Making Reporting Easy with Brightly: Top 5 Energy Reports
We're back with another top 5 reports in our Making Reporting Easy series, focusing on the reports our clients use to gain insight and save time and money.
In a post-COVID world, tighter budgets and leaner staff mean every dollar counts. In commercial buildings, an average of 30% of energy use is wasted. Given this reality and the fact that utility spend is a top budget item for most organizations, operations professionals are looking to better manage their energy to find needed cost saving and efficiency opportunities.
But, you can’t manage what you don’t measure. So, here are the top 5 reports Brightly recommends to take control over your energy.
We created a fantastic energy conservation program, working with the schools and the students, but didn’t realize the impact we were making without visibility into our efforts.
- Rob Haney, Executive Director of Support Operations and Finance at Kenton County School District, KY
And energy management software reporting helps you make those critical decisions even easier with data to back it all up. So, let’s dive into these energy reports.
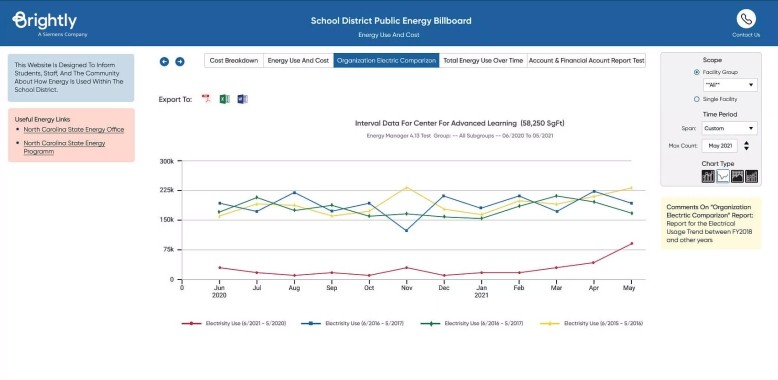
1. Energy Use & Cost
How much energy did I use last year? How much did electricity cost me the past few months?
What It Shows: This type of report will allow you to run historical analysis on energy use and/or cost by facility (or group of facilities), utility type or utility account.
Why It Matters: This type of energy management software report is an Energy Manager’s best friend. They provide data on what you’ve used and spent in the past, so you can confidently make budgetary requests, set improvement goals and analyze success
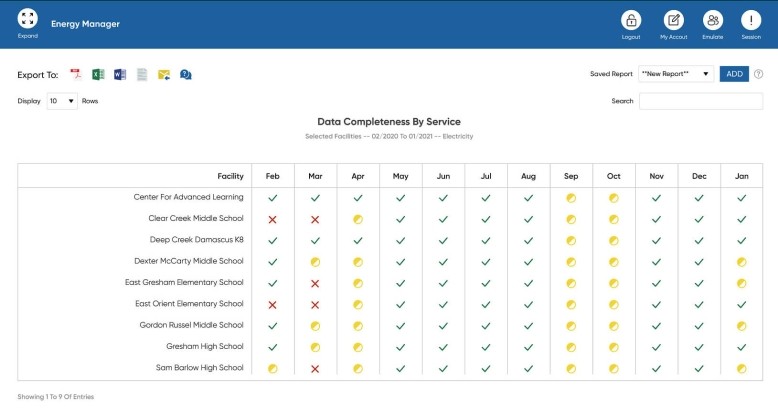
2. Data Management
Is my database up to date? Where am I missing utility bills?
What It Shows: This type of report will allow you to validate if your energy management database is up to date and accurate. And, if there is information missing or that is inaccurate, these will show you where to dig deeper.
Why It Matters: The saying goes, “garbage in, garbage out.” An Energy Manager needs an up-to-date database to make accurate, impactful decisions, and these reports will equip you to identify any barriers to doing so.
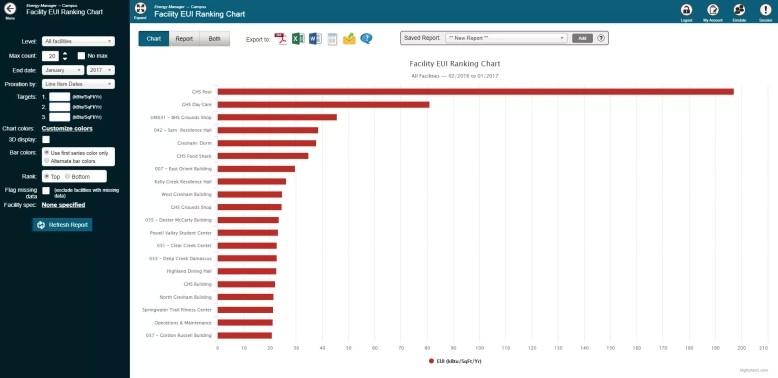
3. Energy Use Intensity
Where are we using more energy than we should be? Which facilities (or group of facilities) are my “energy wasters”?
What It Shows: This type of report normalizes energy use across all utility types for a facility, or group of facilities, to show you energy use per square foot.
Why It Matters: This type of report can help you clearly see which facility, or group of facilities, is using more energy than others. This will allow you to benchmark your facility/building portfolio and properly prioritize action and energy reduction efforts.
4. Avoided Use & Cost
How much am I saving with better energy management practices?
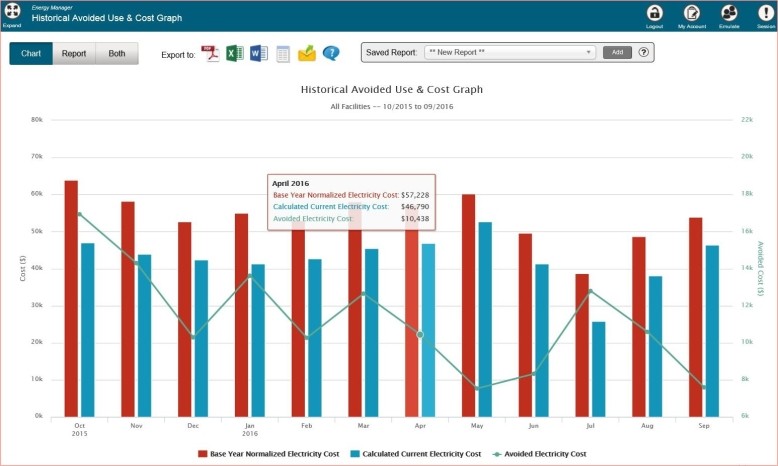
What It Shows: This type of report allows you to see how much energy use or cost has been avoided compared to a benchmark year.
Why It Matters: Utilities will always cost your organization something, but you want to make sure you are spending as efficiently as possible. This type of report is great to help validate your energy management efforts, communicate your wins and determine where you’ve cut down on utility waste.
“We save over $1 million a year, and that equates to about 20 teaching positions because we want to put the money back in the classroom.” -Terry Taylor, Gresham-Barlow School District
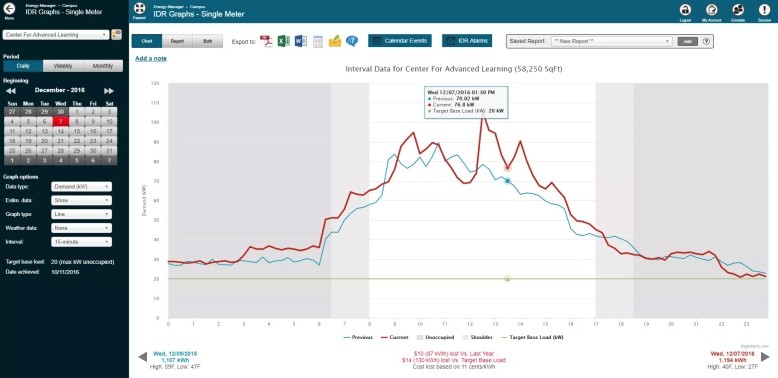
5. Interval Data Recording & Management
How can I locate utility waste before next month's bill?
What It Shows: Interval data reports provide near real-time views of energy use by tracking 15-minute interval readings by way of smart meters or utility companies.
Why It Matters: Instead of waiting for your monthly utility bill, this technology and set of reports will empower you to identify and address waste before you get next month's utility bill.
